Key points
1. Define screening (as opposed to diagnosis), and be able to apply the WHO criteria to determine when screening is appropriate.
Signs are detected on examination while symptoms are reported by the patients. Asymptomatic means without symptoms. Primary Prevention: Preventing the onset of disease in a perfectly healthy asymptomatic person. Secondary Prevention: Detecting a disease in an asymptomatic person. Tertiary Prevention: Preventing recurrence or worsening of disease in someone who already has it. Key point: first step in prevention is often identifying modifiable risk factors.
“Screening” is defined as using a test to identify pre-clinical disease in an asymptomatic person. Screening targets an entire population or subpopulation. Screening targets persons without symptoms of the disease. Screening is not diagnosis.
WHO criteria (https://www.ncbi.nlm.nih.gov/pmc/articles/PMC2647421/):
-
The screening program should respond to a recognized need.
-
The objectives of screening should be defined at the outset.
-
There should be a defined target population.
-
There should be scientific evidence of screening program effectiveness.
-
The program should integrate education, testing, clinical services and program management.
-
There should be quality assurance, with mechanisms to minimize potential risks of screening.
-
The program should ensure informed choice, confidentiality and respect for autonomy.
-
The program should promote equity and access to screening for the entire target population.
-
Program evaluation should be planned from the outset.
-
The overall benefits of screening should outweigh the harm.
We screen for disease to decrease mortality from that disease (the rate of death, i.e. deaths/10,000) without causing more harm than good.
What do we screen for? Examples:
| Type of screening test | Description |
|---|---|
| Physical exam finding | Pap smear, scoliosis |
| Vital | BP |
| Blood test | TB, STI, Hep B, Hep C, HIV, lipids, FBS/A1C |
| Urine test | Urine pregnancy |
| Genomic test | Sickle cell, BRCA, inborn errors of metabolism |
| Imaging | Dental x-rays |
| Cardiovascular test | Stress tests |
| Medical history / questions | Depression, anxiety, alcohol, domestic violence |
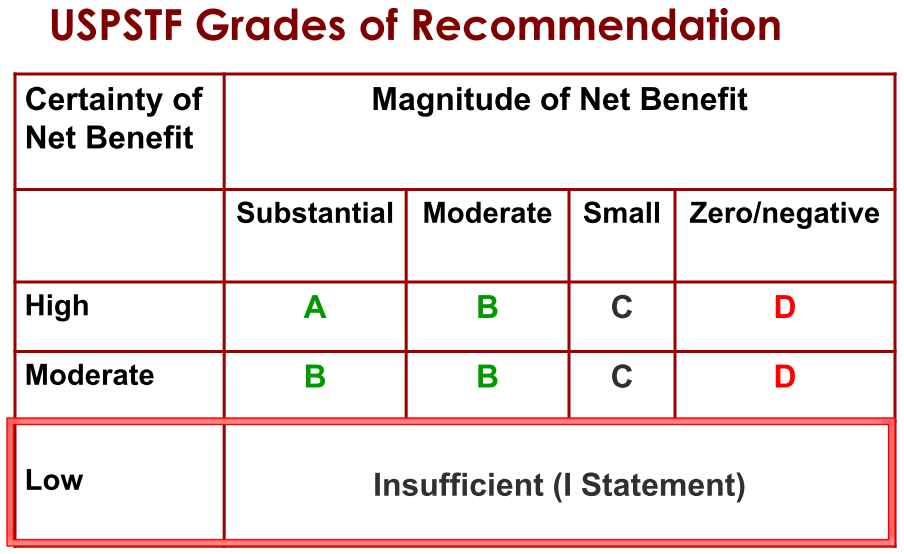
2. Evidence grading system used by USPSTF
USPSTF does not consider financial impact of recommendations. All screening programs do harm, some do good as well.
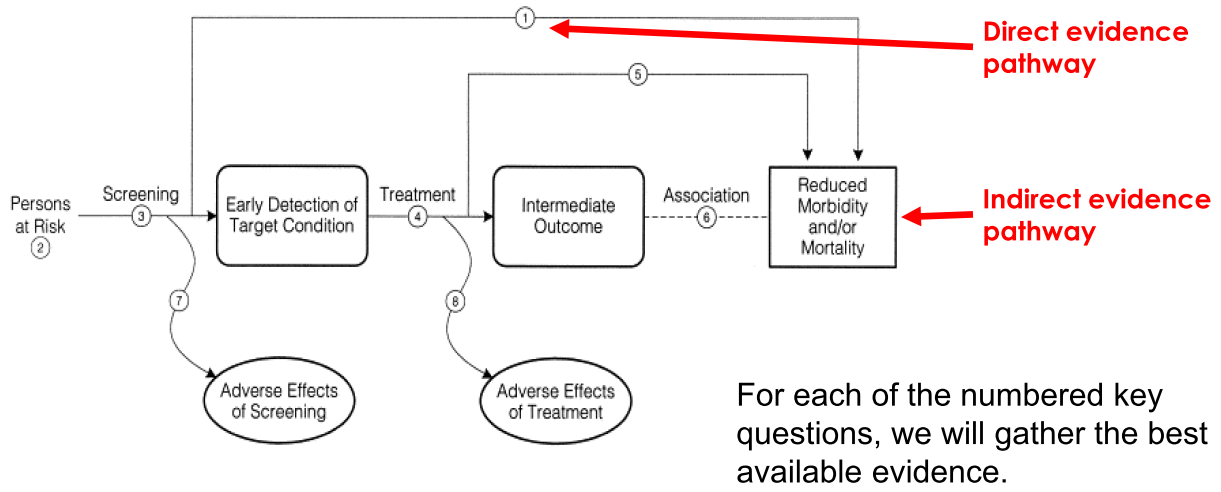
Step 1. Develop a Research Plan. The analytic framework guides which evidence we seek.
Step 2. Develop a draft evidence report to answer each of the key questions.
Step 3. Develop a draft recommendation. Focus is on net benefit, Net Benefit = Benefit - Harm. Based on the evidence summary, for each key question: How certain are we about the benefits and harms? What is the magnitude (size) of both benefits and harms? Get public input and input from experts.
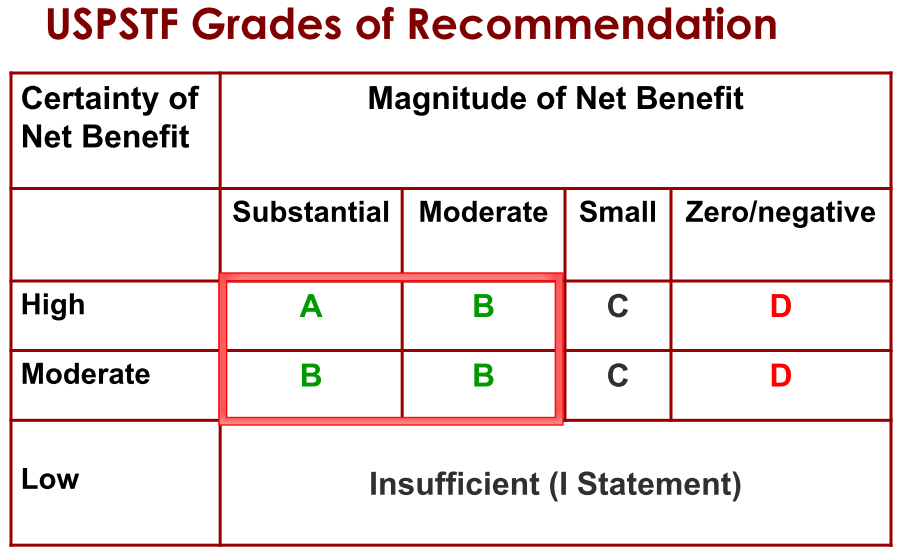
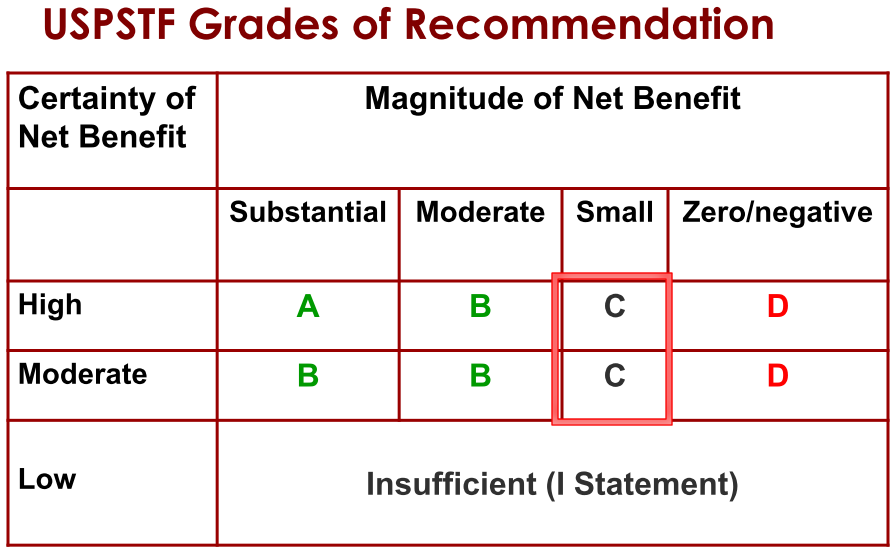
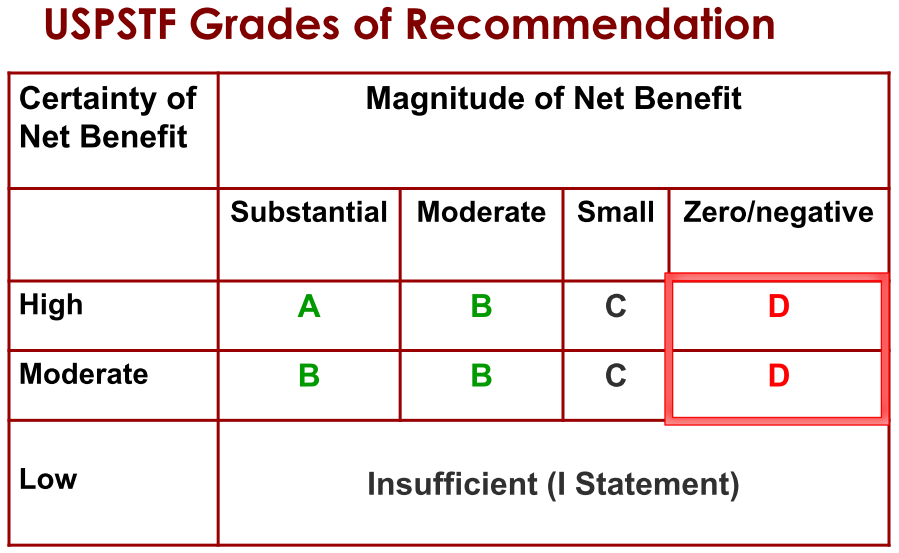
Step 4. Assign a grade based on assessment of magnitude and certainty of net benefit
Step 5. Create Final Recommendation
Determining whether you can trust a guideline“
-
Transparent process: the process for developing and funding the guideline should be clearly and transparently described.
-
Conflict of interest: none or few should have COI; chair or co-chair cannot have COI; financial ties that would create COI are eliminated.
-
Composition of guideline group: includes methods experts, clinicians, stakeholders, and patient representatives.
-
Systematic review: the guideline is based on the results of a good quality systematic review.
-
Strength of recommendation: this is clearly rated for each recommendation, using a taxonomy that incorporates strength of evidence and confidence in the recommendations.
-
Articulating recommendations: recommendations are clearly and concisely listed, and are actionable.
-
External review: stakeholders, experts, and others provide external peer review of the guidelines, including opportunity for public comment.
-
Updating: A process for updating the guideline is stated.
3. Calculate sensitivity, specificity, predictive value, and likelihood ratios given screening test data. Also be able to determine the number needed to screen or invite for one person to benefit.
Sensitivity and specificity
Sensitivity and specificity are important measures of accuracy that do not change as prevalence changes. Predictive value is more easy to interpret and apply clinically, but varies as disease prevalence changes. Absolute risk reduction is preferable to relative risk reduction because it provides a clearer expression of benefit (or harm). Number needed to treat or screen is a useful way to measure the impact of a screening test on health outcomes
Sensitivity = TP / (TP + FN) = a / (a+c)
Specificity = TN / (FP + TN) = d / (b+d)
Positive predictive value (PV+) = TP / (TP + FP) = a / (a + b)
Negative predictive value (PV-) = TN / (TN + FN) = d / (c + d)
Understanding and using sensitivity, specificity and predictive values
Likelihood ratios
LR+ = sensitivity / (1 – specificity)
LR- = (1- sensitivity) / specificity
Likelihood ratios can be especially useful when more than two outcomes
Likelihood ratios: Clinical application in day-to-day practice
RRR, AR, NNT, NNS
Relative risk reduction: reduction in risk relative to comparison (placebo) group
RRR = (event rate in controls – event rate in treated) / event rate in controls
Absolute risk reduction: absolute reduction in risk between groups
ARR = event rate in controls – event rate in treated
Number needed to treat: number who need to receive treatment instead of comparison (placebo) for one more person to benefit NNT = 100% / ARR or 1/ARR
Number needed to screen: NNS to prevent one death due to any cause: Ultimately this is key outcome: all-cause mortality. NNI = number needed to invite to a screening program. For example, let’s say 50,000 women are invited to get a mammogram, and 50,000 are not invited. In the mammogram group there are 50 breast cancer deaths and in the usual care group there are 100. The absolute risk is 0.1% vs 0.2%. The difference or absolute risk reduction is 0.2% - 0.1% = 0.1%. You divide that into 100 to get an NNI of 1000.
Curves
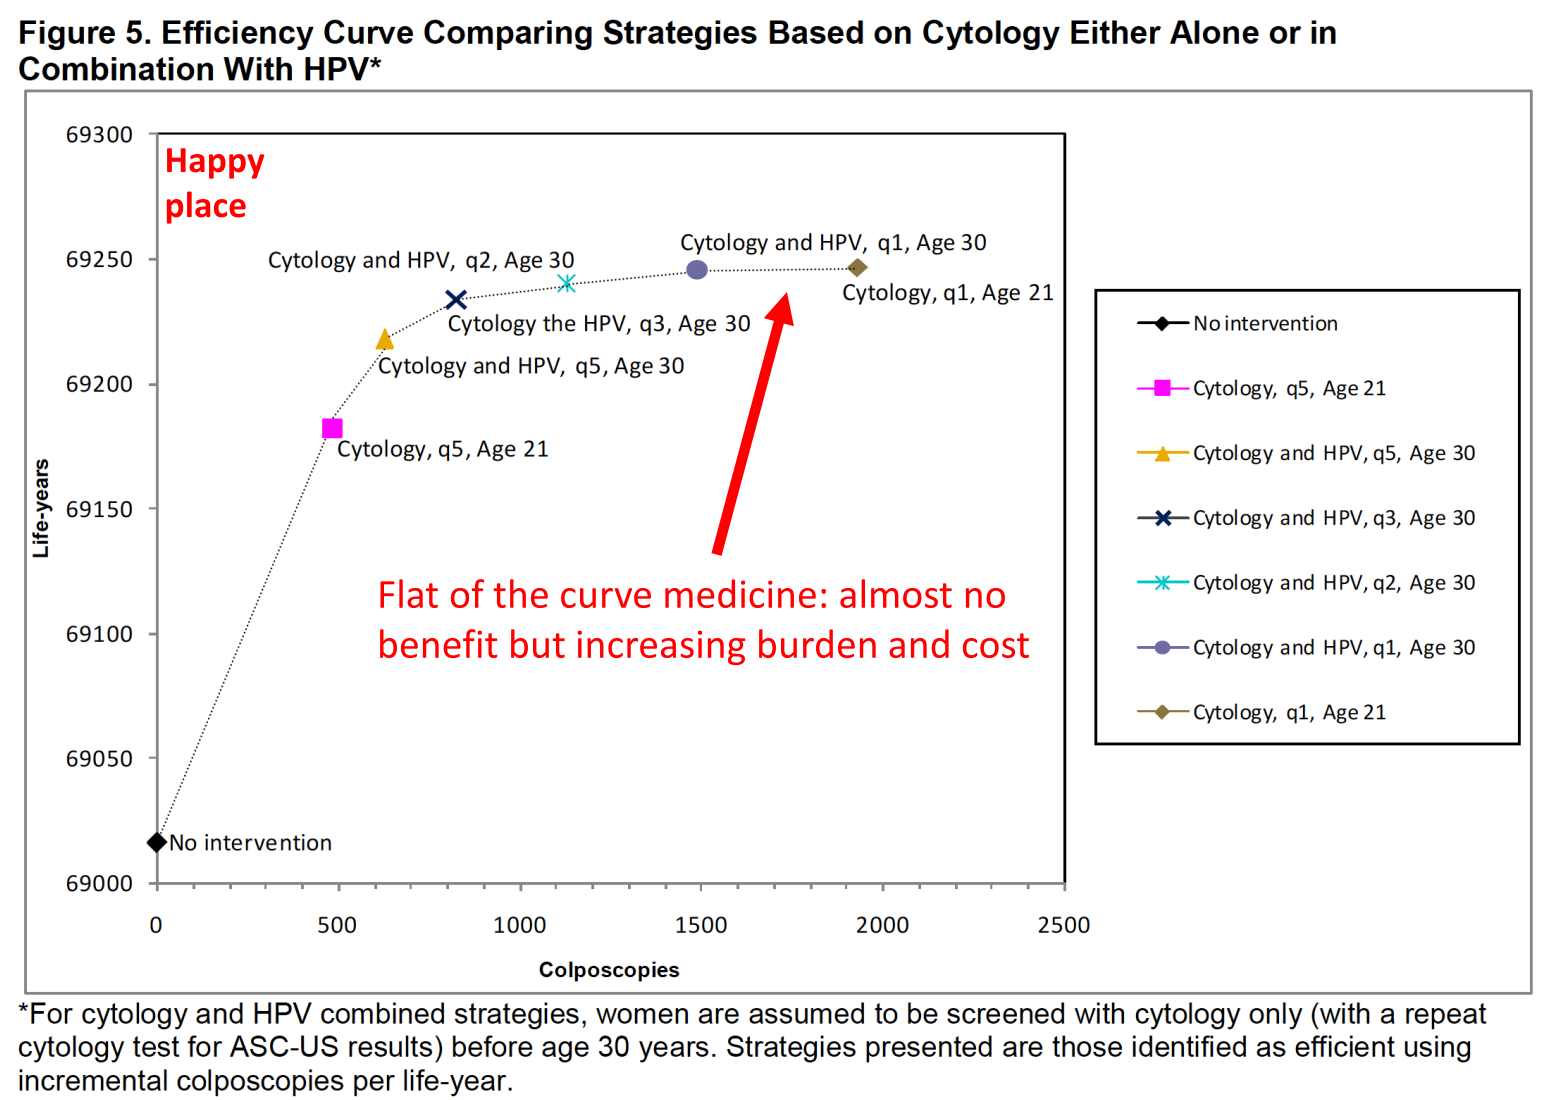
Be able to interpret a forest plot, ROC curve, and efficiency frontier graph.
Forest plot: used in meta-analysis. $I^2$ is the measure of heterogeneity between studies, from 0% (none) to 100% (a lot)
ROC curves: Sensitivity on y axis, (1 – specificity) on x-axis
4. Understand what stage and grade mean in reference to cancer.
Stage is extent of spread, grade tells us how abnormal or aggressive the cancer cells are. Both are important.
Cancer staging: 0 - IV
| Stage | Description |
|---|---|
| 0 | Precancerous lesion or carcinoma in situ |
| I | Typically localized to organ (colon, prostate) |
| II | Tumor extension beyond organ |
| III | Involvement of regional lymph nodes |
| IV | Metastasis: spread to distant organs |
Duke’s for colorectal cancer
| Stage | Description | 5 year survival |
|---|---|---|
| A | Limited to mucosa and submucosa | >90% |
| B1 | Extends into muscularis | 85% |
| B2 | Extends into or through serosa | 70-80% |
| C | Invasion into regional lymph nodes | 35-65% |
| D | Distant metastasis | 5% |
Tumor grade: Refers to how much or little the cancer cells resemble healthy cells. More bizarre cells that are less well differentiated are more aggressive. Different tumors have different grading systems, specific to that cell type and organ. Prostate cancer: a primary and a secondary pattern of tissue organization are identified and each is scored 1-5 (1 looks like normal prostate, 5 looks most abnormal). Scores are added together.Gleason 2–6: The tumor tissue is well differentiated, Gleason 7: The tumor tissue is moderately differentiated, Gleason 8–10: The tumor tissue is poorly differentiated or undifferentiated
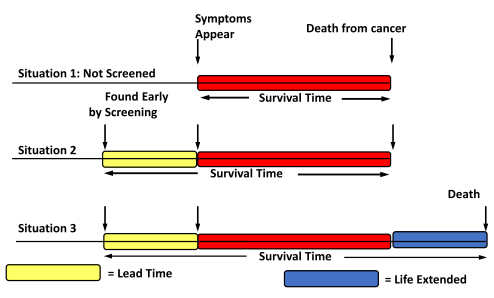
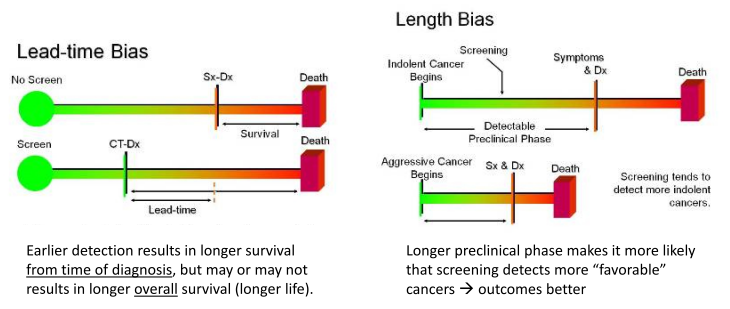
5. Understand lead time bias, healthy volunteer bias, and length time bias.
The “lead time” is the time period between when a diagnosis is detected via screening and when it would have first caused symptoms. Remember: mortality is not the same thing as survival. 5 year survival is a good way to measure results in a treatment trial when all patients have a similar stage of disease, but NOT for screening. Earlier stage doesn’t always translate to better outcomes.
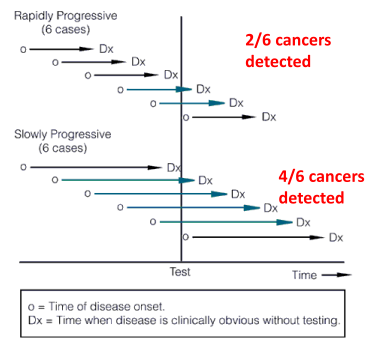
Length time bias. Some cancers are very aggressive and grow quickly, others are less aggressive and grow more slowly. Screening tests are more likely to identify the slower growing, less aggressive tumors. They are around longer to detect (tortoise). Fast growing, aggressive tumors are more likely to arise between screening intervals (hare). This results in a systematic bias that overestimates survival duration among screen-detected cases due to the relative excess of slowly progressing cases. Probability of detection is directly proportional to the length of time during which they are detectable, and inversely proportional to the rate of progression
Healthy participant bias (also “healthy volunteer bias”). Volunteers for studies are healthier than non-volunteers and have better outcomes than non-volunteers. The existence of healthy participant bias has important implications for cancer screening trials in particular. Design 1: Randomize patients to two groups, Invite patients from group A to screening, compare attenders in Group A with all patients in Group B (attenders and non-attenders). Design 2: Invite patients to screening, Randomize attenders to group A screening vs Group B no screening. Design 1 would bias strongly in favor of screening, since non-attenders in Group B generally have worse outcomes.
Summary
Lead time bias: lengthening time from diagnosis to death, but not overall years lived
Length time bias: detecting cancers by screening that are slower growing and missing faster growing cancers
Healthy volunteer bias: volunteers for studies are healthier than non-volunteers and have better outcomes than non-volunteers
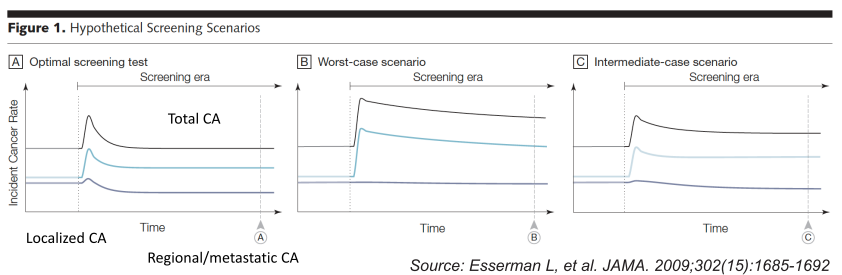
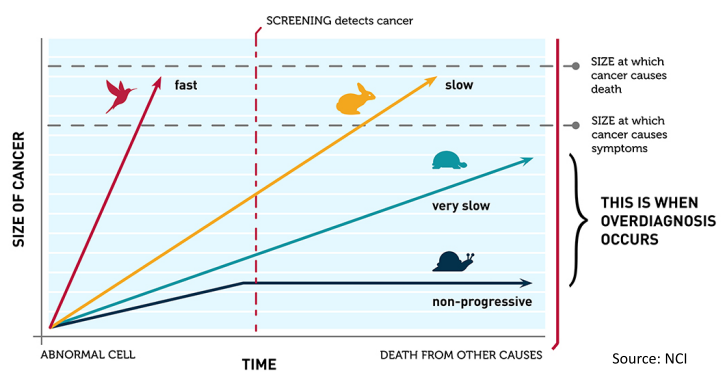
6. Define overdiagnosis, and three different ways that it can occur.
Overdiagnosis and overtreatment: detecting and treating disease that never would harm the person.
Overdiagnosis: Scenario A (optimal): Initial increase in incidence, but over time regional/metastatic cancers decline with relatively small increase in localized disease. Scenario B (worst-case): Initial increase in incidence, but over time no decline in regional/metastatic disease. Scenario C (intermediate): Initial increase in incidence, over time increased localized disease persists but somewhat less regional/metastatic CA. Overdiagnosis occurs when screen-detected cancers are either non-growing or so slow-growing that they would never cause medical problems.
Improving quality by doing less: overtreatment
Improving quality by doing less: overdiagnosis
7. Explain why 5-year survival is not a good outcome measure for screening studies.
Lead Time Bias: Don’t be deceived by 5-year survival! This results in overestimation of survival duration among screen-detected cases (vs usual care), and a higher 5 year survival. Problem is that survival is measured from time of diagnosis to death, rather than from time of enrollment in a trial to death or as a mortality rate. Earlier diagnosis gets included in overall survival time, but how long the patient actually lives may be unchanged.
8. Be able to list basic risk factors, signs and symptoms of ovarian, colorectal, breast, lung, and prostate cancer.
Ovarian cancer
-
Risk factors: Family history: 1 st or 2 nd degree relative; BRCA1, 2 carriers; Hormone replacement therapy.
-
Signs and symptoms: Typically vague gastrointestinal and urinary tract symptoms, caused by pressure of tumor on GI tract and bladder: Bloating; Increased abdominal size; Frequent urination; Abdominal pain; Pelvic pain.
-
Protective factors: Oral contraceptive use (RR 0.5); Increased number of pregnancies, breastfeeding; Tubal ligation
Colorectal cancer (CRC)
-
Risk factors: It takes approximately 10 years for an adenomatous polyp to become cancerous; Most CRCs arise from preexisting adenomatous polyps; Chronic inflammation increased risk.
-
Signs and symptoms: Blood in the stool; A change in bowel habits, such as diarrhea, constipation, or narrowing of the stool, that lasts for more than a few days
Breast cancer
-
Risk factors: Not being physically active. Women who are not physically active have a higher risk of getting breast cancer. Being overweight or obese after menopause. Older women who are overweight or obese have a higher risk of getting breast cancer than those at a normal weight. Taking hormones. Some forms of hormone replacement therapy (those that include both estrogen and progesterone) taken during menopause can raise risk for breast cancer when taken for more than five years. Certain oral contraceptives (birth control pills) also have been found to raise breast cancer risk. Reproductive history. Having the first pregnancy after age 30, not breastfeeding, and never having a full-term pregnancy can raise breast cancer risk. Drinking alcohol. Studies show that a woman’s risk for breast cancer increases with the more alcohol she drinks.
-
Signs and symptoms: New lump in the breast or underarm (armpit)
Lung cancer
-
Risk factors: Tobacco use measured in pack-years; Increasing age; Radon and radiation exposure
-
Signs and symptoms: Cough; Weight loss; Hemoptysis
Prostate cancer
-
Risk factors: Family History
-
Signs and symptoms: Difficulty starting urination. Weak or interrupted flow of urine. Frequent urination, especially at night. Difficulty emptying the bladder completely. Pain or burning during urination. Blood in the urine or semen. Pain in the back, hips, or pelvis that doesn’t go away. Painful ejaculation
9. Suggest innovative strategies to improve screening uptake in a population.
Methods to increase participation in organised screening programs: a systematic review
10. Be able to design a study to evaluate the impact of a screening program on mortality, and a study that assesses accuracy.
We screen for disease to decrease mortality from that disease (the rate of death, i.e. deaths/10,000) without causing more harm than good. Not just increased survival from diagnosis, but reduced mortality. Critical – no point in screening if not treatable. Sensitivity is most important for initial screening test, specificity for confirmatory test. Screening tests usually do not have all of these characteristics.
11. Make rational arguments for starting age, stopping age, and intervals for a screening program.
Be able to explain why we select starting ages and screening intervals for cancer screening. For example, we start adding HPV co-test at age 29 and not age 21 because HPV is common in adolescent women
Evaluating the Benefits and Harms of Colorectal Cancer
12. Be able to critically appraise a study of screening.
Lead time bias, length time bias
13. Create a comprehensive list of the potential benefits AND harms of screening.
14. Interpret an analytic framework for a screening test, and understand direct and indirect pathways in such a framework (Be able to construct/understand an analytic framework).
One example
15. What are the 4 characteristics of a good preventive service or intervention?
The condition being prevented/intervened on is an important cause of a clinically preventable burden.
The service is acceptable to the population of interest (easy to access, low cost and time commitment).
The benefits of the service outweigh the harms (evidence from RCT or meta-analyses to support this).
The cost is acceptable (should lean towards saving money and saving lives in the health policy space).
Updated Priorities Among Effective Clinical Preventive Services
16. Be able to determine the proportion of a population that has to be immune to achieve herd immunity given the basic reproductive number R.
Proportion immune = $1 - 1/R_0$
17. Be able to define and apply the concepts of test positivity rate (including WHO criteria for what indicates that enough testing is being done), doubling time, infected fatality ratio, and case fatality ratio.
Test positivity rate: WHO states it should be < 5% for 14 days. Jurisdictions where it is < 5% for 14 days are doing enough testing. If rates are significantly higher, only the sickest patients are being tested, so many cases are being missed, which means contact tracing and isolation can’t occur.
doubling time: This is the number of days required for the number of cases in a population to double.
Mortality parameters
| Parameter | Definition |
|---|---|
| Confirmed case fatality ratio | deaths/confirmed cases |
| Case fatality ratio | deaths/symptomatic cases |
| Infected fatality ratio | deaths/(symptomatic + asymptomatic cases) |