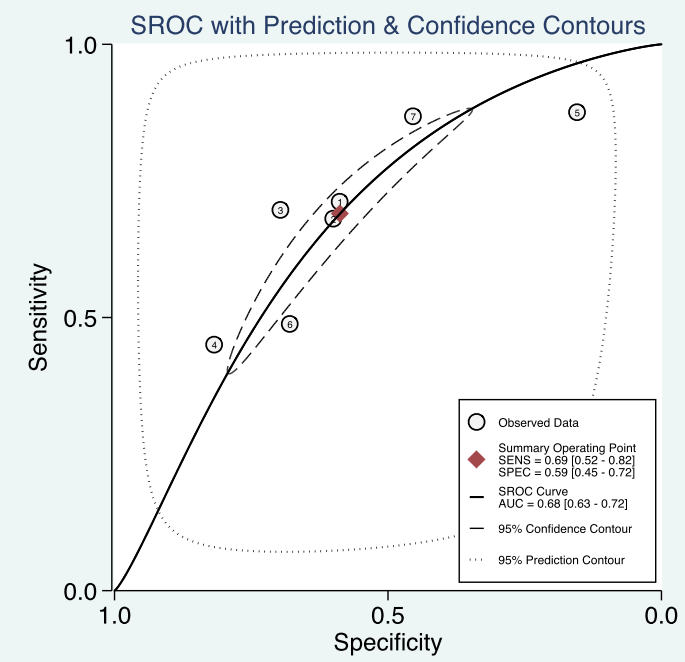
ROC curves
Receiver operating characteristic (ROC) curves:Signal detection theory (Radar)

Key
-
Sensitivity is on y axis, 1 – specificity on x-axis (100% - specificity if using percent)
-
Area under the ROC curve is generally between 0.5 (useless) to 1.0 (perfect)
-
Area is proportional to ability of a test to discriminate diseased from non-diseased. It is an important tool for comparing tests.
-
It is useful for identifying the best cutoff to define an abnormal test
-
Slope of a curve = y/x = Se / (100-Sp)
-
The slope at any point on the curve is also the positive likelihood ratio!
-
Closest to upper left corner. Youden’s J: point that maximizes sensitivity + specificity - 1