Sensitivity, specificity and predictive value
Formula
Pretest probability
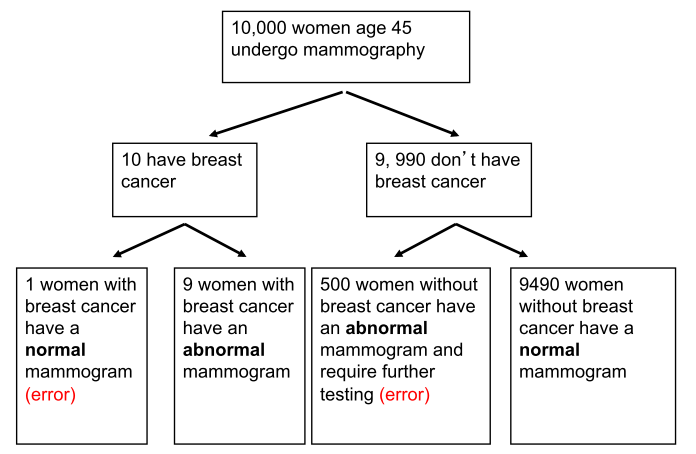
Screening: Screening for breast cancer, where disease is rare (let’s say 10 in 10,000)
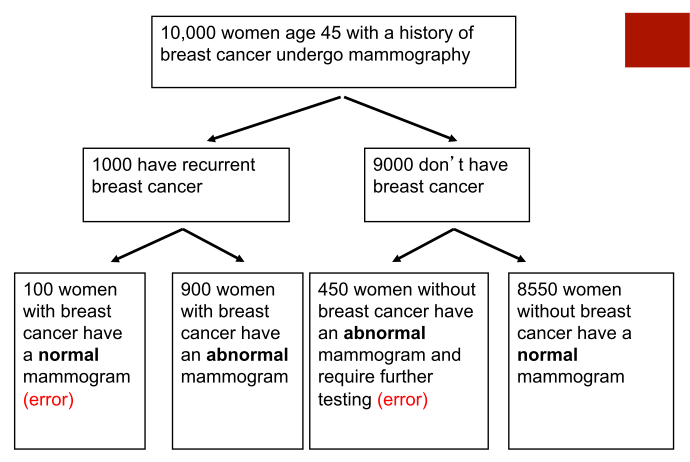
Surveillance: Surveillance in women diagnosed with breast cancer in the past two years, where recurrent or contralateral disease is much more common (let’s say 1 in 10 or 10%).
Sensitivity = TP / (TP + FN) = a / (a+c)
Specificity = TN / (FP + TN) = d / (b+d)
Positive predictive value (PV+): PV+ = TP / (TP + FP) = a / (a + b) = Post-test probability of a positive test having disease
Negative predictive value (PV-): PV- = TN / (TN + FN) = d / (c + d) = Post-test probability of a negative test not having disease
Examples
Low pretest probability
| Common | Breast cancer present (D+) | Breast cancer absent (D-) | |
|---|---|---|---|
| Mammogram positive (T+) | A: 9 | B: 500 | 509 |
| Mammogram negative (T-) | C: 1 | D: 9490 | 9491 |
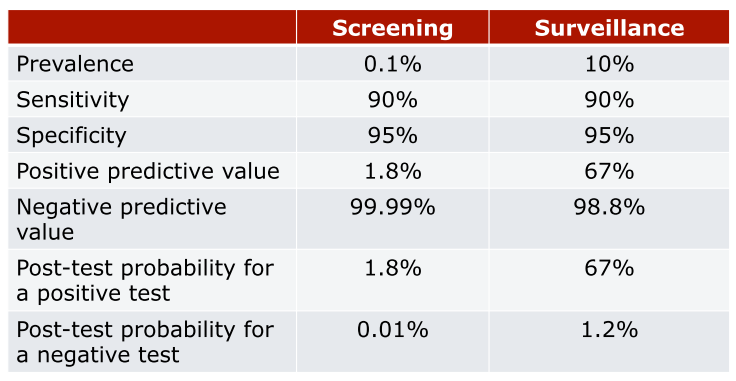
Pre-Test Probability: 10/10,000 = 0.1%
-
Sensitivity: 9/10 = 90%
-
Specificity: 9490/9990 = 95%
-
Positive predict value: 9/509 = 1.8%
-
Negative predict value: 9490/9491 = 99.99%

High pretest probability
| Common | Breast cancer present (D+) | Breast cancer absent (D-) | |
|---|---|---|---|
| Mammogram positive (T+) | A: 900 | B: 450 | 1350 |
| Mammogram negative (T-) | C: 100 | D: 8550 | 8650 |
Pre-Test Probability: 1000/10,000 = 10%
-
Sensitivity: 900/1000 = 90%
-
Specificity: 8550/9000 = 95%
-
Positive predict value: 900/1350 = 67% (up from 1.8%)
-
Negative predict value: 8550/8650 = 98.8% (down from 99.99%)


Likelihood ratios
We’d like the measure to be a feature of the test so it is stable across different prevalences/pretest probabilities
Likelihood ratio (LR): the ratio of the Probability that an individual with disease has the test result to the probability that an individual without disease has the test result.
-
Positive likelihood ratio (LR+): LR+ = 4, when 80% with disease have a positive test divided by 20% without disease have a positive test. LR+ = Sensitivity / (100 – specificity). “How well does a positive test help us rule in disease?”.
-
Negative likelihood ratio (LR-): LR+ = 0.1, when 9% with disease have a negative test divided by 90% without disease have a negative test. LR- = (100 - sensitivity) / specificity. “How well does a negative test help us rule-out disease?”.
Sensitivity and specificity are characteristics of the test and don’t change with pretest probability of prevalence. Because LR is calculated using sensitivity and specificity, it also doesn’t change when prevalence changes
| LR | Interpreting likelihood ratios |
|---|---|
| >10 | Strong evidence for disease |
| 5 - 10 | Moderate evidence for disease |
| 2 - 5 | Weak evidence for disease |
| 0.5 - 2 | No significant change |
| 0.2 - 0.5 | Weak evidence against disease |
| 0.1 - 0.2 | Moderate evidence against disease |
| <0.1 | Strong evidence against disease |
Key
Using multiple categories of normal or abnormal can provide richer, more useful information from a test
Likelihood ratios can be used to interpret these “polytomous tests” and correspond to how we think about ruling in and ruling out disease